The Forklift Safety System Dashboard Says It All
There have been many articles written lately about the benefits of telemetry systems or Dashboard systems for the industrial sector. All the articles tout the wonderful nature of the telemetry system and the depth and breath of information for decision making improvements. However, with the benefits comes certain downfalls. These downfalls have been around for a while and include areas such as too much information, a poor design, or inconsistent data within the system. And this can all be true for most systems, but when it is driven by your customer base, SIERA AI can say that our AI forklift safety system Dashboard says it all, right up front.
The Problem with Many Dashboards
As we just noted above, there are some regular issues with dashboards. One of the first issues with dashboards is too much information. This can be where it takes a lot of work to find the answers, and it can take hours in order to extract it. From their experiences, one of our customers asked, “will I need to hire a full time employee to work in the Dashboard in order to extract the information I’m looking for?” Clearly, they had more than one less than optimal experience.
The next common issue is poor design. If you can’t get to the information you are searching for easily, then the design is poorly executed. This can cause the professionals to not use the system due to frustration. Even if they use support, that doesn’t always guarantee success. So how does a dashboard fair with a forklift safety system?
The Forklift Safety System Dashboard Says It All
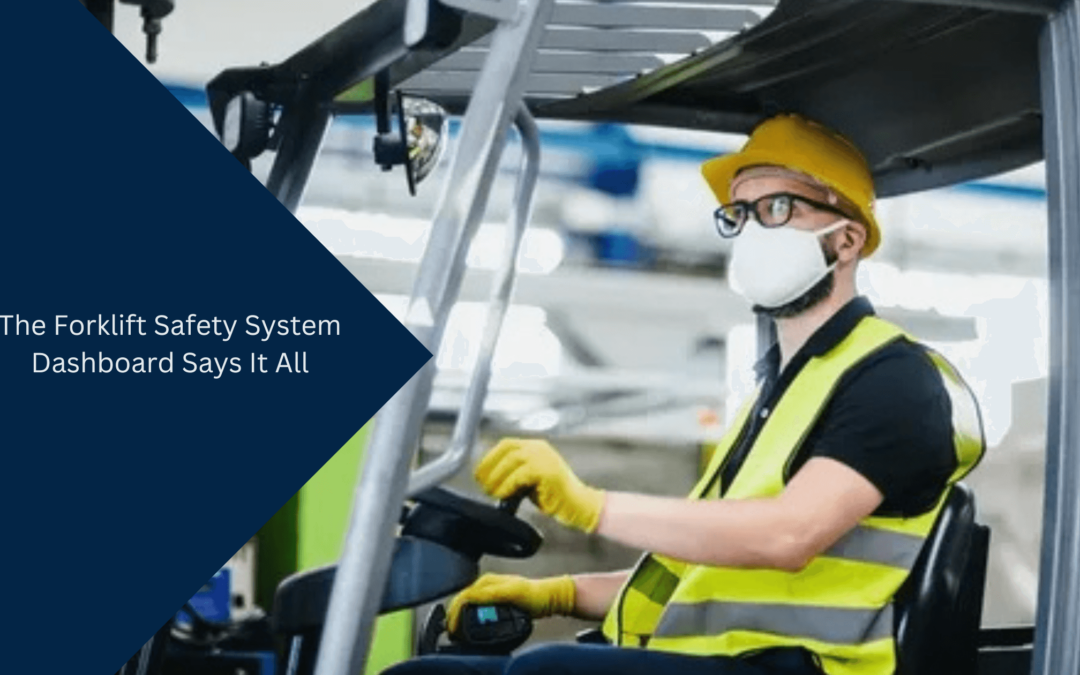
It may seem unimportant to have a dedicated Dashboard for a forklift safety system, but for an AI forklift safety system Dashboard says it all. The intelligent cameras on the AI forklift safety system is constantly collecting data and automatically placing it in ‘buckets’ for easy analysis and therefore, decision making.
Our telemetry Dashboard has been driven by our customers, so they get the information that they need. If one customer needs it, you can bet that others need it too! Here’s some of the key information that is graphically displayed automatically. You get to set the start and end date for analysis.
- Pass / Fail from the digital forklift inspections
- Near Misses for pedestrians and Near Misses for objects
- Low, Medium and High impacts based on the G-Force settings that you assign
Reporting
There are some different combinations that you can use with the reporting system in order to pinpoint the answers you are trying to extract. For instance, you want to know where are most of the ‘near misses’ occurring within the facility. Remember, near misses are those where accidents didn’t occur, but almost did. These are accidents that are slowly maturing where an accident is predicted to occur.
You can generate a report that will give you the ‘hot spots’ of where the near misses are most frequent. Now as a safety professionals, you can visit those areas and make safety adjustments. Next, begin to watch in real-time on the Dashboard if near misses are still occurring, or if they are reducing. Now you can make additional changes or be done with the issue.
Let’s take the next step and show you what it looks like, so you can begin to reduce injuries and accidents to improve productivity, safety and reduce expenses. And remember, the forklift safety system Dashboard, says it all!
Contact Us!
Contact us today at sales@siera.ai or call us at (512) 817 0702.