Lagging Forklift Safety Indicators vs. Leading Forklift Safety Indicators – Defined
To set the foundation for discussion, we need to begin by defining what leading safety indicators and lagging safety indicators mean. The most effective definition was developed by The Campbell Institute, and it states, “Safety leading indicators are proactive measures that measure prevention efforts and can be observed and recorded prior to an injury. As opposed, safety lagging indicators are reactive measures that track only negative outcomes, such as an injury, once it has already occurred.”
Lagging Forklift Safety Indicator Metrics
Safety metrics has traditionally focused on the lagging safety indicator metrics with counts and statistics on injuries, fatalities, and/or common forklift accident types such as forklift rollovers, hitting a pedestrian, and damaging the infrastructure. These forklift metrics are incredibly useful as it indicates a serious forklift safety problem within the facility.
SIERA.AI has come across situations where the facility has a very low forklift accident rate, meaning their lagging forklift safety indicator metrics appear to be on the positive side of the statistic. However, does that mean that there aren’t any workers or pedestrians getting injured by a forklift and all is safe within the facility? It may mean that they’ve put together a very tight, stringent safety program that pays special attention to high-risk areas, OR they’ve put a horseshoe above every door and they’ve grown four leaf clovers in planters throughout the facility.
Leading Forklift Safety Indicator Metrics
Before we get started, let’s take a look at the Campbell Institute again as they further refined the definition of leading safety indicators. They state: “Safety leading indicators are proactive measures that measure prevention efforts and can be observed and recorded prior to an injury. As opposed, safety lagging indicators are reactive measures that track only negative outcomes, such as an injury, once it has already occurred.” Let’s take a look at a few areas where we can group some of the leading safety indicators together.
Operations within the Facility
This is a good area to start. Since everyone here are operations specialists, let’s take a look at some areas where you can track leading forklift safety indicators. In your facility, you may want to determine productivity gains, risk factors, maintenance or preventative maintenance and of course safety training.
Each of these are critical areas to track. But how? How can you collect this type of data (and other types of data) in a proactive way that gives you leading forklift safety indicators? The adoption of forward-thinking technologies such as AI machine learning can help you get there.
By having a digital forklift inspection checklist with impact detection, you’ll be able to manage the life of the forklift asset lifecycle in order to manage costs, downtime, maintenance, as well as collect data on various levels of impacts and near misses. In addition, use video or take a picture of who or what caused a failed inspection and/or an impact over a defined threshold, and more. All of this information is stored in our single Dashboard for all of SIERA.AI’s safety solutions.
Behaviors within the Facility
This certainly includes operators, workers and pedestrians. It can include what you or others may be noticing but to correct behavioral actions, you need data to back up any claims. We just spoke about the digital forklift inspection checklist with impact detection, now let’s discuss proactive forklift safety and the behaviors it can help modify, correct and manage.
Here are a few areas it will collect and store in our Dashboard:
- Forklift Pedestrian Detection – this includes partial pedestrian or full pedestrian detection. When no one is paying attention, the S3 safety system is scanning every 60ms around the forklift. If a pedestrian (objects too) comes too close, and audio alarm and visual cues will notify the operator.
- Speed Control – Understand how fast the operators are going so you can determine why and take the necessary action to correct the behavior.
- Access Control – Gain control with pictures or video (person or just the forklift) over managing who touches the forklift to ensure it is only the person assigned…and on shift.
- Collect data in ‘zones’ – Know who/what crosses the safe green zone into the yellow (warning) zone and who/what crosses from the yellow (warning) zone into the red (danger) zone. Know if it was a person, object or part of the facility or infrastructure.
- Overriding the Operator – As the ultimate forklift safety solution, the ‘slow to a safe stop’, allows you to track how many times the forklift operator was overridden by the AI forklift safety system.
Data Collection in a Web-Based Dashboard
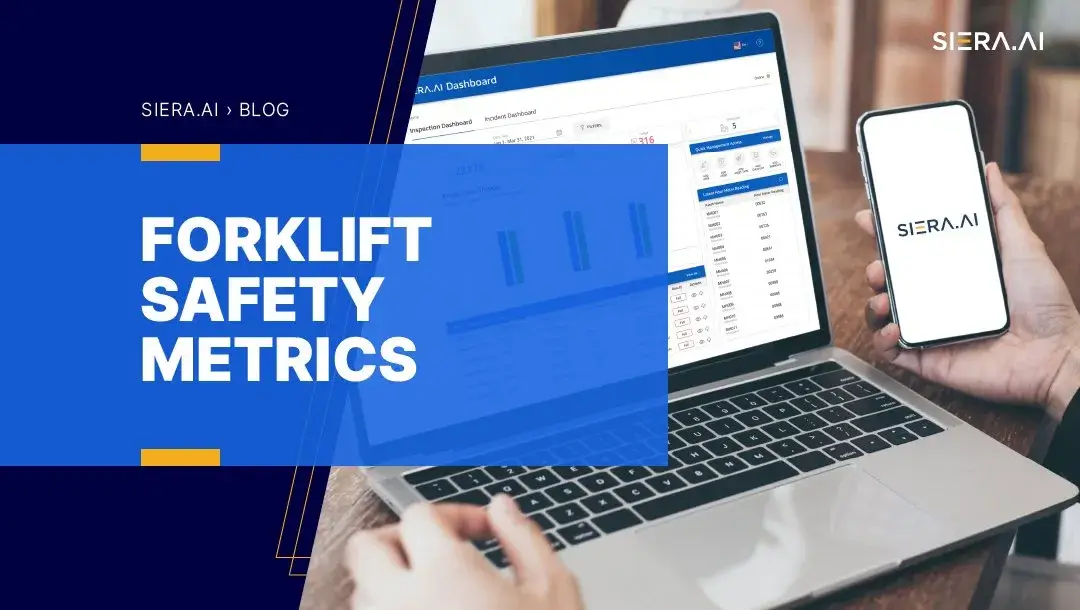
As you can imagine, there’s much more to cover such as the web-based Dashboard. This is the central repository for all of the data collected whether it’s from the S2, S3 pedestrian detection or S3 slow to a safe stop.
The data is placed in an easy to read and track format so you can begin to make decisions on anything from forklift safety training to access control to the overall health of the fleet down to the individual forklift.
Take the Next Step Safety Professionals
Are you ready to confirm your leading forklift safety indicator metrics? You’ve worked hard to put detailed health and safety plans together. Be sure that your plans include SIERA.AI’s AI machine learning technology that can help you reach your goal of Zero forklift accidents. Now you can give the horses back their shoes and Ireland their magical clover.
Book a Risk-Free Trial
Or Get a Custom Quote
We just need a few details to get you started.

